


This week, Archo Advocacy released its 2025/2026 ELAVAY Advocacy Intelligence Report, and if you follow patient advocacy news, you’ve probably already seen the headlines. Novartis leads on partnerships. Pfizer tops policy engagement. Johnson & Johnson holds the reputation crown. League tables make for easy sharing, and the industry will spend the next few weeks congratulating winners and quietly benchmarking against them.
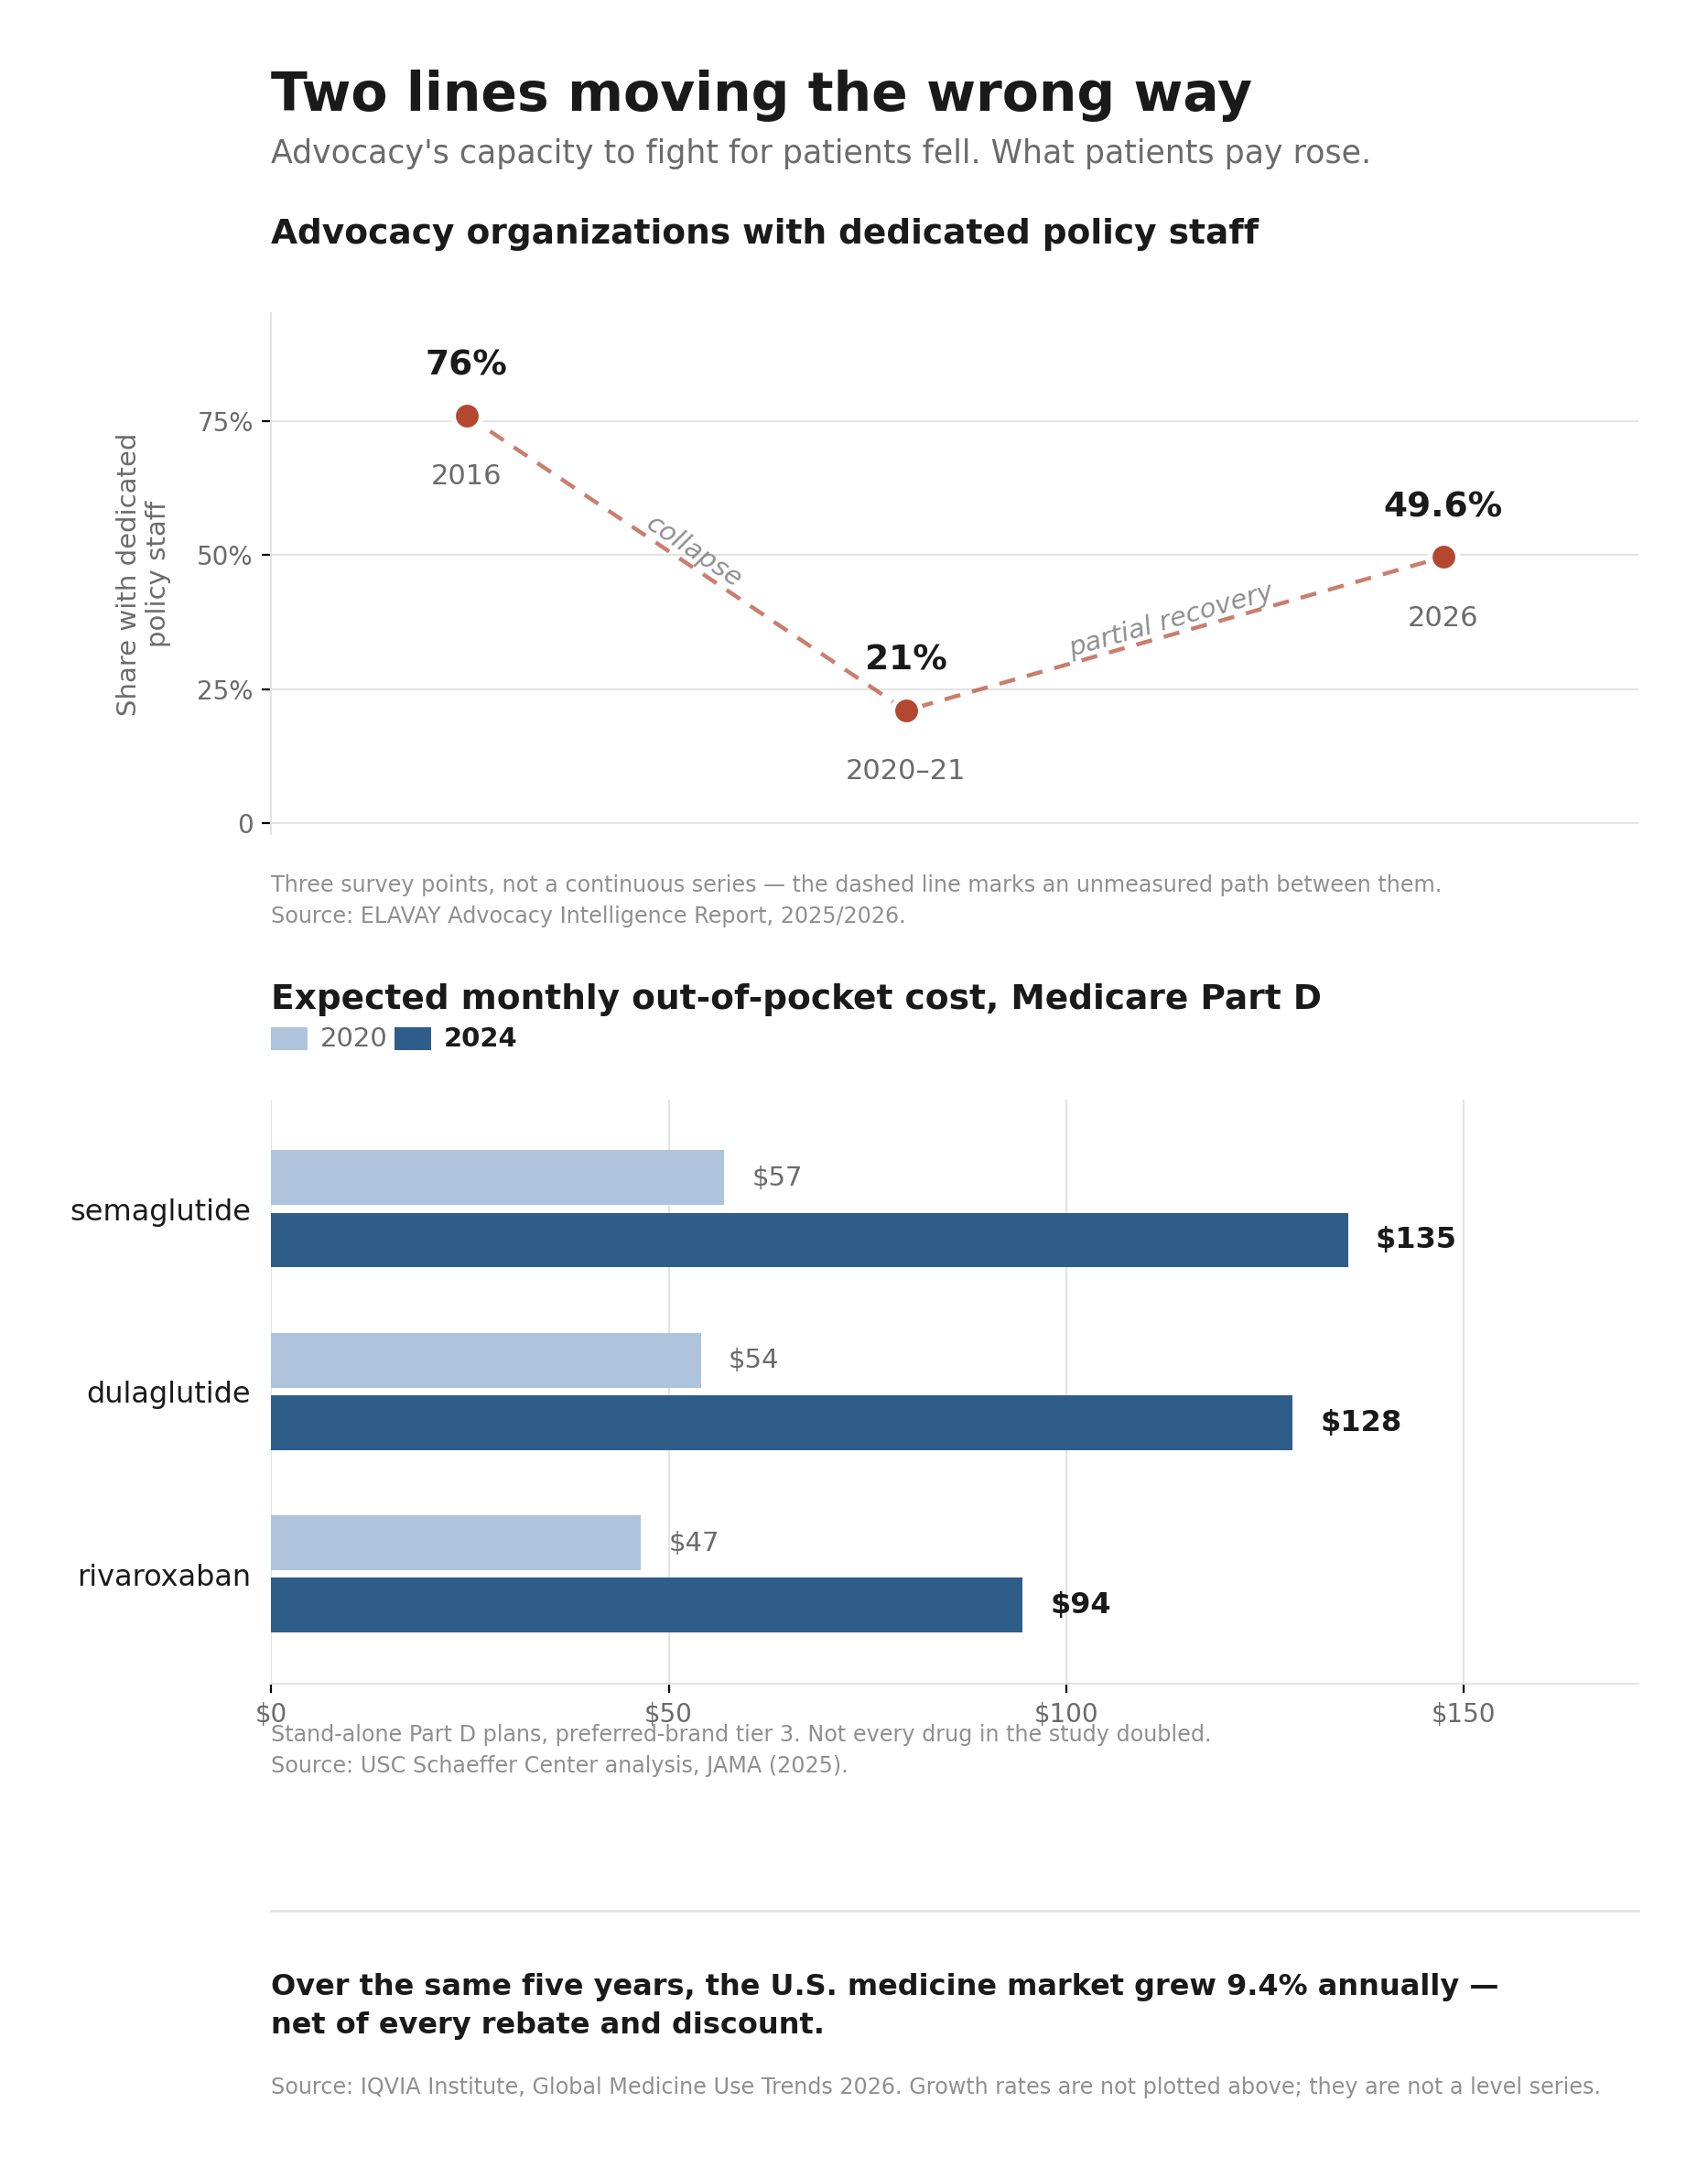
But the number worth sitting with isn’t in the rankings. It’s buried further down, in the section on what advocates are seeing on the ground: only 49.6% of advocacy and community-based organizations maintain dedicated policy staff.
Half. In the middle of the most consequential decade for health policy most of us will ever live through.
A decade of lost capacity — and only a partial recovery
That 49.6% figure only makes sense in context. In ELAVAY’s 2016 survey, 76% of advocacy organizations reported dedicated policy staff. By the 2020-2021 survey period, that number had fallen to 21%. Today’s figure represents a recovery — but “recovery” is doing a lot of work in that sentence. We’re still 26.4 percentage points below the 2016 figure.
Think about what that arc means. Three out of four advocacy organizations once had someone whose job was to track legislation, build relationships with staffers, translate patient experience into policy language, and show up when the committee doors opened. By the 2020-2021 survey period, roughly four out of five respondents reported having no dedicated policy staff at all.
What happened
The survey tells us what happened, not why. So let me be clear that what follows is my read, not the report’s finding.
One plausible explanation is that the pandemic forced organizations into brutal triage decisions, and policy work — slow, relational, hard to measure — lost out to direct patient services that couldn’t wait. When your community is calling because they can’t get to chemo appointments or can’t afford their copays, you redirect every dollar and every person to the immediate crisis. That would have been the right call in the moment. It would also have carried a cost that didn’t show up until later.
Layer on funding contraction, staff burnout, and the reality that many community-based organizations never had the budget for a policy hire in the first place, and the drop starts to look less like a mystery and more like an inevitability. Policy capacity is the first thing cut and the last thing rebuilt, because its absence doesn’t hurt on any single day. It hurts across years.
I’ve watched this from inside the work, not as a policy professional, but as one of the volunteers. I’ve sat in congressional offices, on federal peer review panels, and on steering committees, and the pattern I notice isn’t about any one organization’s staffing. It’s about how much of the field’s institutional knowledge lives in a very small number of people, and how often the person in the room carrying a community’s policy ask is doing it on top of a full-time job and a treatment schedule.
Volunteer advocates are powerful. We bring lived experience no staffer can replicate, and the organizations that invest in training us get something they can’t hire for. But we are not a substitute for someone who wakes up every morning tracking markup schedules. When an organization has both, it’s formidable. When it has only us, it’s improvising, and improvisation doesn’t hold up across a ten-year policy fight.
What the gap years cost us
Here’s the part that should keep advocacy leaders up at night: the years when policy capacity sat at its lowest point were also the years when the biggest policy windows in a generation opened.
The Inflation Reduction Act’s drug pricing provisions were negotiated as ELAVAY’s policy-capacity measure hovered near its 2020-2021 low, when only 21% of surveyed organizations reported dedicated policy staff. Over the same stretch, PBM reform moved in Congress and in statehouses, and biomarker testing, step therapy, and non-medical switching bills moved through state legislatures, the exact issues that determine whether our communities can actually access the treatments the industry celebrates.
Who was in those rooms? Some organizations, certainly — the largest and best-funded ones. But by ELAVAY’s own measure, the surveyed field was operating at a fraction of its earlier capacity during the moments that mattered most.
The report offers a telling data point on how that played out. Asked about the IRA — arguably the most significant drug pricing law in decades — advocates are split: 43.0% expect it to benefit their patients, 34.4% expect a neutral or unclear impact, and 22.7% expect harm. That division may partly reflect real uncertainty about how the law lands across different patient populations, disease areas, and payer mixes. It may also reflect how unevenly advocacy organizations were positioned to engage while the legislation was taking shape.
That’s what losing policy muscle costs. Not a bad headline. A decade of downstream consequences.
This isn’t just a decision. It’s a financial asymmetry.
Here’s what makes the capacity gap more than a resourcing story: it opened during the exact years the industry across the table was posting record numbers.
Start with one company. Eli Lilly reported revenue growth of 45% in 2025, in a single year, from a base that was already enormous. That is the scale of the organization sitting across the table when access policy gets written.
Zoom out and the direction holds across the industry, and it holds even on the industry’s own preferred measure. Drug pricing arguments usually stall out on list price versus net price: manufacturers rightly point out that rebates and discounts now offset roughly 46% of invoice value, so headline prices overstate what companies actually collect. Fine. Use the net number. By IQVIA’s own accounting, the U.S. market grew at a 9.4% net compound annual rate over the past five years — after every rebate and concession — driven by oncology, immunology, and obesity. IQVIA projects the global market will keep growing at 5% to 8% annually through 2030, reaching roughly $2.6 trillion.
Read that against the ELAVAY arc one more time. The five years the U.S. market compounded at 9.4% net are the same five years advocacy’s policy staffing fell to 21% and clawed back to under half.
Neither number is a direct measure of lobbying capacity, and I won’t pretend otherwise. Rising sales don’t automatically mean bigger government affairs teams. But they illustrate the scale of resources available to major manufacturers relative to almost every patient organization in the country, and that structural gap is the point.
Now look at what happened to patients over the same stretch. This is where the asymmetry stops being abstract:
Among stand-alone Medicare Part D plans placing preferred branded drugs on tier 3, the share using coinsurance rather than fixed copayments rose from 9.9% in 2020 to 71.9% in 2024. Coinsurance ties what you pay to a percentage of the drug’s price rather than a predictable flat fee — exposing beneficiaries far more directly to price increases. Notably, this shift did not happen to the same degree in Medicare Advantage drug plans, where comparable coinsurance use stayed below 5%.
Expected out-of-pocket costs more than doubled for several commonly used preferred-brand drugs in those stand-alone plans. Semaglutide went from about $57 to $135; dulaglutide from about $54 to $128; rivaroxaban from about $47 to $95.
Cost-related underuse is persistent and measurable. In the 2021 National Health Interview Survey, 8.2% of adults ages 18-64 who used prescription medication reported skipping doses, taking less, or delaying a fill because of cost. Among insulin users under 65, 20.4% reported cost-related rationing — 14.3% among those adequately insured, and 33.7% among those underinsured or uninsured.
And all of this landed on top of a broader cost-of-living squeeze. The same families absorbing bigger drug bills were navigating the sharpest U.S. inflation surge in roughly four decades, with higher costs for housing, food, and other necessities — which means the real erosion of their ability to afford treatment was steeper than the drug numbers alone show.
So stack the trends against each other. Industry revenue: up and to the right. Patient out-of-pocket exposure: up and to the right. Advocacy’s professional policy capacity, the one force in that equation whose entire job is to push back on behalf of patients, fell by more than half at its low point and has since recovered only part of the loss.
This is the part that reframes the whole conversation. The advocacy capacity gap wasn’t just an unfortunate internal decision that organizations made in hard times. It was a financial and political power shift. When advocacy lost its policy staff, patients didn’t just lose a few voices in a few rooms. They lost negotiating leverage at the precise moment the stakes, and the price tags, were climbing fastest.
Rebuilding without a policy hire
If you lead a small or mid-sized advocacy organization, the honest response to all of this might be: I agree, and I still can’t afford a policy director. Fair. So here’s what rebuilding can look like short of a full-time hire:
Join coalitions that pool policy capacity. Coalition memberships let ten organizations share what none of them could afford alone. The relationships and intelligence flow both ways.
Explore shared policy fellows. Some state-level coalitions and national organizations have experimented with policy staff who serve multiple member organizations. If yours hasn’t, propose it.
Train your volunteer advocates deliberately. Programs that put patients through structured research and policy training, the kind of preparation I’ve received through research advocacy programs and federal review panels, turn lived experience into something that functions in a policy room. That training is an investment, not a nice-to-have.
Ask more of your partners — carefully. Partnership shouldn’t just mean program funding. Where the arrangement is transparently governed, ask partners for nonexclusive educational briefings, public legislative tracking, and technical background. But hold the line hard here: retain your own policy positions, disclose the financial relationship, and never let a funder’s government affairs shop become your source of truth. An organization that outsources its policy thinking to the industry it negotiates with hasn’t rebuilt capacity. It’s rented someone else’s.
None of this fully replaces a dedicated hire. But 49.6% doesn’t become 76% again through wishing. It gets rebuilt through a thousand small decisions to treat policy capacity as core infrastructure rather than a luxury.
The question under the rankings
The ELAVAY report rewards companies for showing up in the rooms that shape patient access. That’s a reasonable thing to measure, and the companies that lead those tables have earned recognition.
But the harder question isn’t which companies show up. It’s whether the patient community can still afford to show up across from them. Because a room where one side commands resources at a scale the other has never approached, and where the other side’s professional capacity fell by more than half and has only partly returned, isn’t much of a negotiation. It’s a room where a lot gets decided before anyone sits down.
The rankings will change next year. The capacity gap underneath them is the story that compounds, and closing it is on us.
Sources: Archo Advocacy, 2025/2026 ELAVAY Advocacy Intelligence Report (July 2026) — staffing and IRA sentiment figures are from ELAVAY’s survey series; methodology detail on cross-year comparability is limited in the public release. Industry growth figures: IQVIA Institute, Global Medicine Use Trends 2026 (March 2026) — U.S. 9.4% five-year net CAGR is historical; the 5-8% global CAGR and ~$2.6T by 2030 are IQVIA projections. Eli Lilly 2025 revenue growth: Lilly earnings report. Medicare Part D coinsurance and drug-specific out-of-pocket figures: USC Schaeffer Center analysis published in JAMA (2025). Cost-related medication underuse: 2021 National Health Interview Survey. Insulin rationing: 2021 study of U.S. insulin users under 65.